
Grade it the way you already do.
Condition A to D and priority 1 to 4, with safety and energy flags.
Your teams capture defects building by building. The portfolio dashboard turns them into one live grid.
Condition A to D and priority 1 to 4, with safety and energy flags.
Multiple photos per line item, GPS and time-stamped.
Voice dictation comes back as text against the item it describes.
The day's work uploads when your team is back in coverage.
Each building in the estate keeps its status and its latest report on one screen.
Explore the portfolio dashboard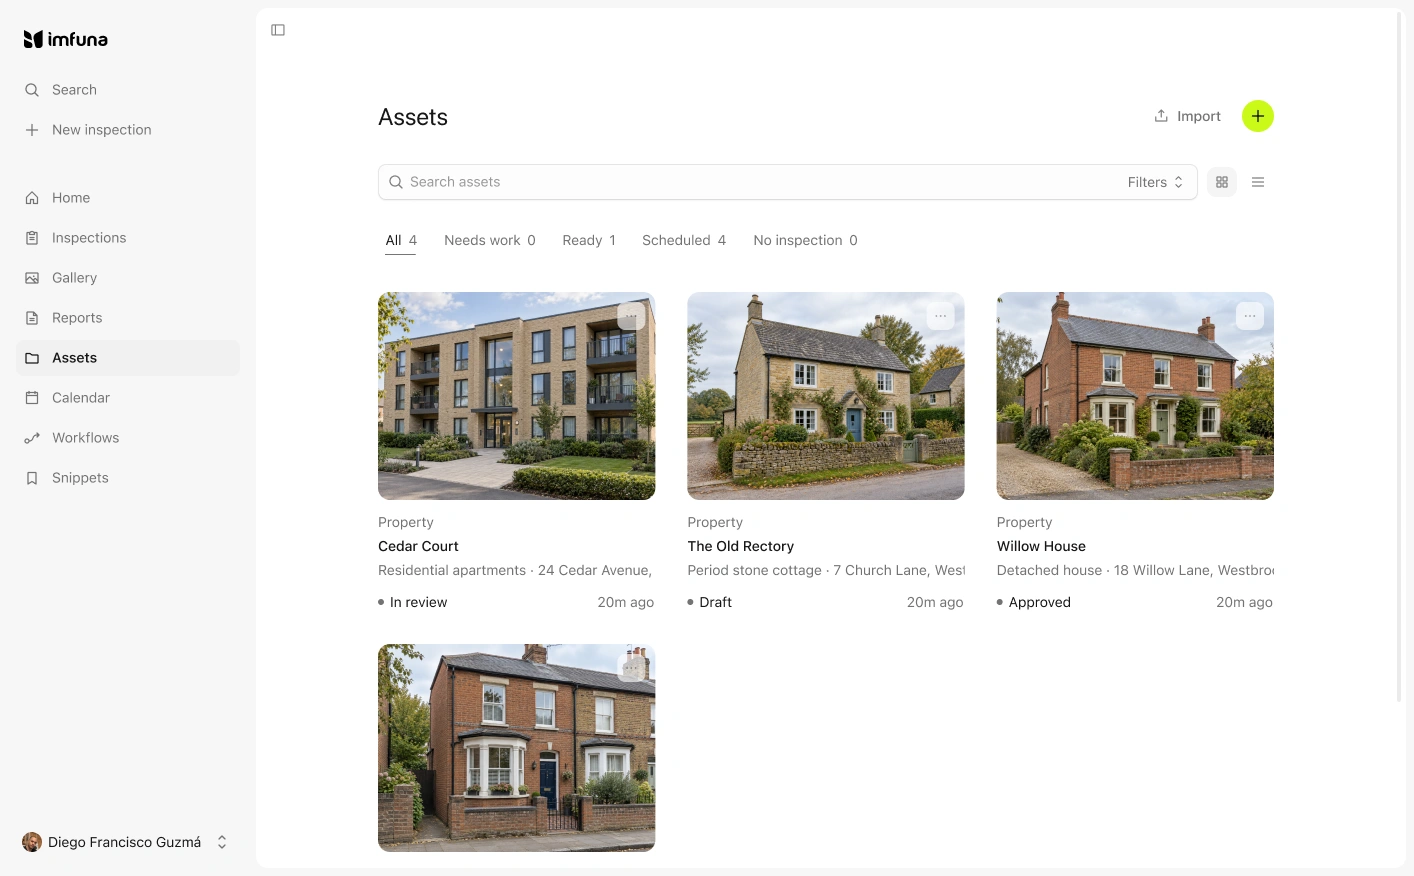
Charts on screen, Excel for the data, and a branded portfolio report from any filtered view.
Book a dashboard demoEvery building's next inspection goes into one shared week, so each inspector knows where they are going.
Explore the web platformA to D and 1 to 4, filterable across the portfolio.
A cost per issue, with a presentation-only uplift.
Your own workflow: who changed what, and when.
By severity, status, cost, priority or year.
Every exported row deep-links to its photos.
A branded PDF of any filtered view.
Carry the structure over and edit what changed.
Field teams capture; managers work the dashboard.
Stock condition, PPM and compliance surveys run on the report you already issue, and the dashboard reads its grades and costs.
Flagged findings land in Fixflo as maintenance issues.
MRI properties arrive ready to inspect; reports return.
All inspection data out to Excel, for any other tool.
Your field team captures on a phone or tablet. Anything can be corrected on the web platform afterwards (ratings, notes, costs, photos) without revisiting site. A new contractor quote updates the totals in seconds.
A live demo takes 30 minutes, on how you work today.